Somos el mayor centro comercial y de entretenimiento del país 🛍️
⏰ D a J de 10 a 21hs. V y S de 10 a 22hs
🍽 Plaza de Comidas 1 hora más todos los días
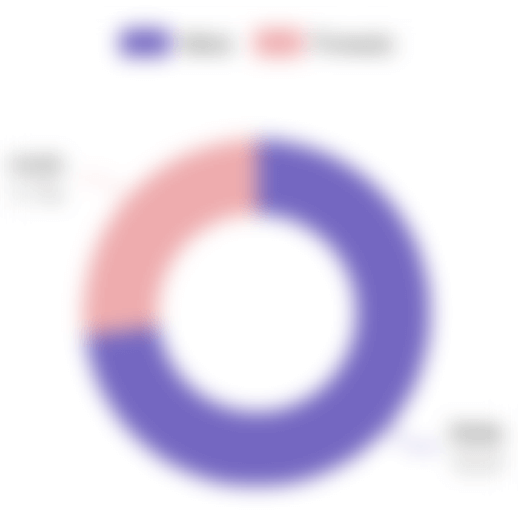
78.4% of @mvdshopping's followers are female and 21.6% are male. Average engagement rate on the posts is around 0.05%. The average number of likes per post is 49 and the average number of comments is 11.
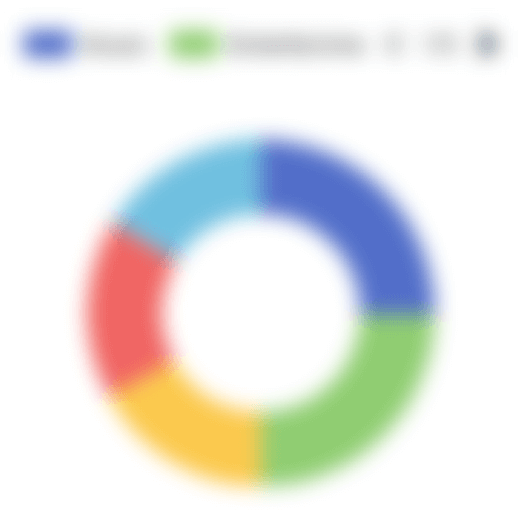
@mvdshopping loves posting aboutEntertainment and Music,
Actors.

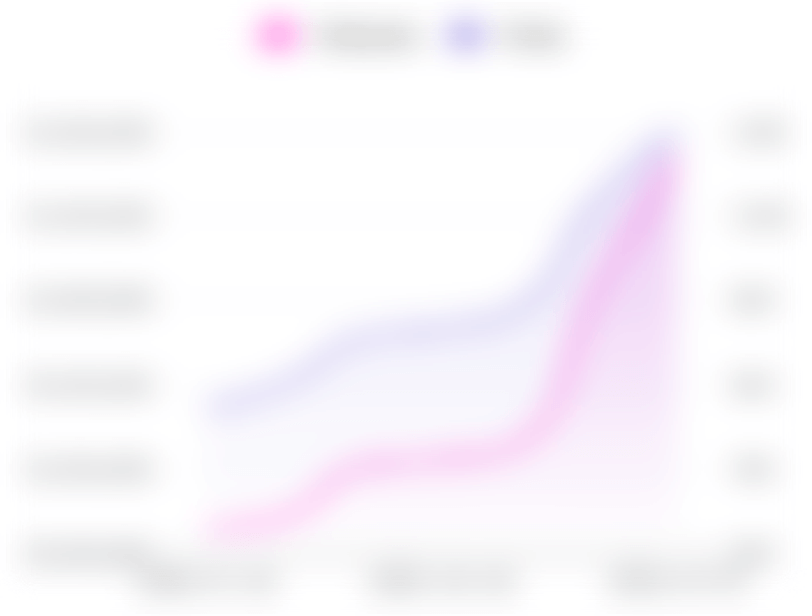
224,681
Followers

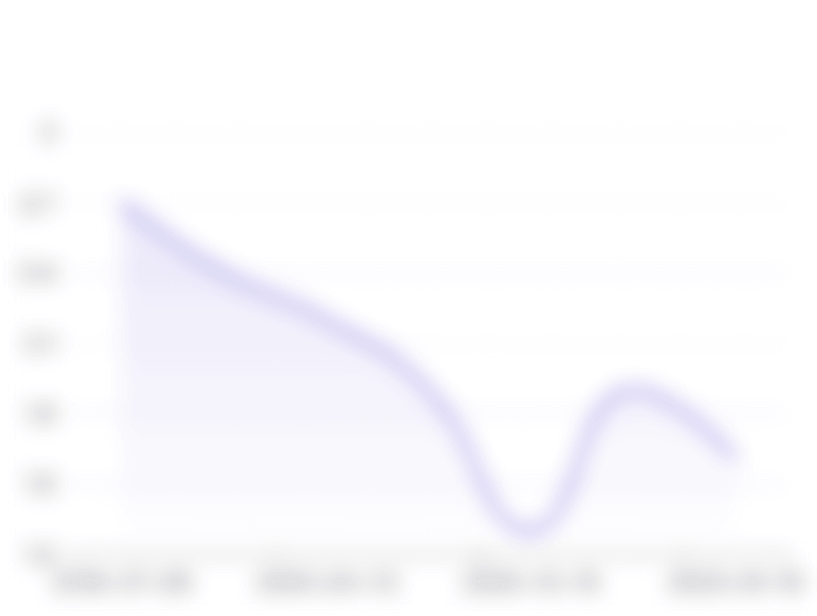
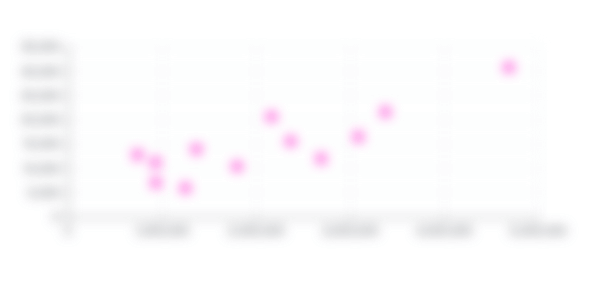
0.05%
Engagement Rate


60
Engagement per post
49
Average likes per post
11
Average comments per post

174,783
Global Rank
-
Country Rank
-
Category Rank

Mentions - accounts
Mentions - hashtags

4
3

Similar Accounts


Recent Posts


* Copyright: Content creators are the default copyright owners. These information including images, texts, videos, posts and profiles are published on public domains and respective social media for public viewing.
FAQ: Instagram Statistics and Insights for @mvdshopping
How can I access Instagram statistics and analytics for @mvdshopping?
StarNgage offers comprehensive analytical reports that provide key metrics and insights to give you a complete understanding of @mvdshopping. You can explore various aspects, including Instagram follower statistics, such as follower and post growth trends, Engagement Rate, and its growth trends. Additionally, you can access information on the average number of likes and comments per post, insights into your followers or audience demographics, brand affinity data, mentions of relevant hashtags, similar accounts, and the most recent posts.
What is the current follower count for @mvdshopping on Instagram?
As of the latest update, @mvdshopping has accumulated a dedicated following of 224,681 followers on Instagram.
What insights and analytics are included in the full report for @mvdshopping on Instagram?
Our full Instagram analytical report provides a comprehensive overview of @mvdshopping on Instagram. This report includes detailed information on follower growth over time, engagement metrics, and post frequency, both on a weekly and monthly basis. To access this in-depth report, kindly register and create a new StarNgage account or log in to your existing account.
Can I track how @mvdshopping Engagement Rate has evolved on Instagram?
Yes, StarNgage's analytics tools allow you to monitor the evolution of @mvdshopping Engagement Rate over time on Instagram. This data helps you assess the effectiveness of @mvdshopping engagement strategies.
How can understanding @mvdshopping audience's demographics on Instagram?
Gaining insights into @mvdshopping audience's demographics on Instagram can be immensely valuable. It enables you to tailor your influencer content and marketing strategies to better resonate with @mvdshopping followers, as you'll have information about their age, gender, location, and interests.
How can I leverage brand affinity data to improve my marketing strategy on Instagram with @mvdshopping?
Brand affinity data is a powerful tool to understand which brands or products your audience is most interested in. This information can guide your content collaborations and partnerships on Instagram, enhancing your engagement with your target audience.